Monitoring with Checkmk
19. March, 2022 • 5 min read • Homelab
Identify issues or failures real-time
I'm a data hoarder; that's nothing new to people who know me. This year around, I drove my passion a little bit further and streamlined my setup. The following articles will be a multi-part series introducing various areas such as:
- Introduction
- Virtualisation using a PowerEdge R820
- Storage with a QNAP TVS-1271U-RP
- Networking with Ubiquiti
- Media streaming with Plex
- Download management with SABnzb and Transmission
- Service management with Sonarr, Radarr, Lidarr, Readarr, Bazarr and Mylar
- Additional tools like Calibre, Ubooquity, Ombi or Organizr
- Monitoring with Checkmk
Why monitoring at home
It is good practice to monitor your infrastructure. You want to know when, where and why an issue occurred and ideally fix it quickly. At Divio we go even further and automate the process of resolving these issues as much as possible, so little human interaction is needed.
However, at home, that might be a bit overkill. Nonetheless, I still want to know if something is not working as it should. Most notably:
- Diskspace: react before space runs out and avoid outages
- Heat: ensure the hardware is appropriately cooled for longevity
- Usage: how much CPU or Memory is utilized
- Data: are there any package losses
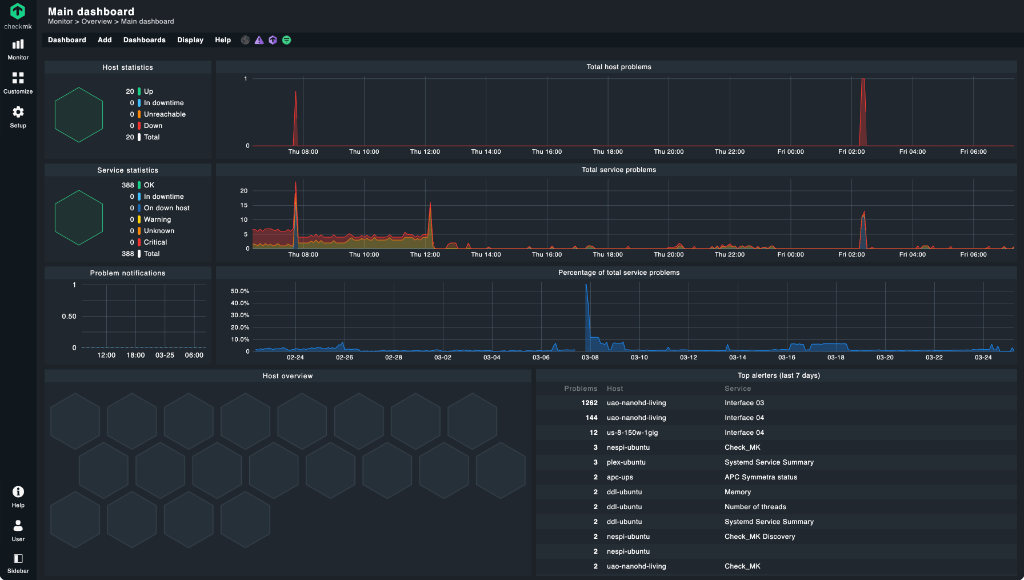
Monitoring using Checkmk

There are several free, open-source monitoring services out there. Most notably Nagios, Zabbix and Prometheus/Grafana. However, I settled for another popular one, Checkmk. Checkmk has excellent docs, is easy to install, and the raw edition is entirely open-source. Connecting the infrastructure is also very straightforward by using Checkmk’s agents. To get started, make sure you have a separate Ubuntu VM instance running where we will install Checkmk on top of it.
The Checkmk documentation has a pretty good Beginner’s guide, so I recommend reading through it to understand the basic principles. I will focus on the installation and configuration only in this article.
Installation
To start the installation, download the correct package for your system from the product selection. I will use the Checkmk Free Edition to get additional features to play with that the raw edition doesn’t support. The free edition is limited to one instance and a maximum of 25 hosts, which is not a problem for me. However, if you want to monitor more hosts, progress by installing the raw edition.
Download the package and install it on your server by moving it via scp or directly:
wget https://download.checkmk.com/checkmk/2.0.0p21/check-mk-free-2.0.0p21_0.focal_amd64.deb

apt install openssh-server
apt install dpkg-sig
wget https://download.checkmk.com/checkmk/Check_MK-pubkey.gpg
gpg --keyserver keys.openpgp.org --recv-keys 434DAC48C4503261
gpg --armor --export 434DAC48C4503261 > Check_MK-pubkey.gpg
gpg --import Check_MK-pubkey.gpg

dpkg-sig --verify check-mk-free-2.0.0p21_0.focal_amd64.deb

sudo apt install check-mk-free-2.0.0p21_0.focal_amd64.deb
You can test if the installation was successful by running omd version. It should show something like OMD - Open Monitoring Distribution Version 2.0.0p21.cre.
Next, you want to create a site. Follow the subsequent step-by-step instruction to set up a site. In short:
omd create homelab
omd status
Mind the instructions shown to you, and then start and stop your site by running omd stop or omd start, respectively.
Finally, open the web interface http://x.x.x.x/homelab and login with the username cmkadmin and the password you set up through the site creation process.
Agents
Now, we need to add hosts to monitor. To do this, head to Setup > Agents (Windows, Linux, Solaris, AIX). The easiest is always to register the monitoring server itself. This step is also recommended by Checkmk’s documentation. In our case, we download “Linux / Deb” package. Rename that file on your computer to “agent.deb” and copy it over via scp. Then install it:
scp ~/Downloads/agent.deb user@x.x.x.x:/home/organizr/agent.deb
sudo dpkg -i ./agent.deb
That is all you have to do on any system you want to add. Some systems do not require an agent if they have built-in SNMP support. Also, have a look at the available agents. You can register ESXi and vSphere by using VMWare ESX via vSphere and track the VMs altogether.
Configuration
To add a new host, head to Setup > Hosts and click on Add host. The only option to configure is the IPv4 address. Alternatively, you can also set up a hostname and use it instead. Click on Save & go to service configuration and add all discovered services by clicking on Fix all. Next, on the top right, click on x changes followed by Activate on selected sites. This action will activate your first monitored host.
Continue this with all other hosts until all of them are added. And then start figuring out what goes wrong and why by googling 🤣.
So what’s next
Well – that’s it 🤩. This is the last article I intended to add to this series. Though, there might be independent articles related to my homelab in the future.
‘Till next time!